

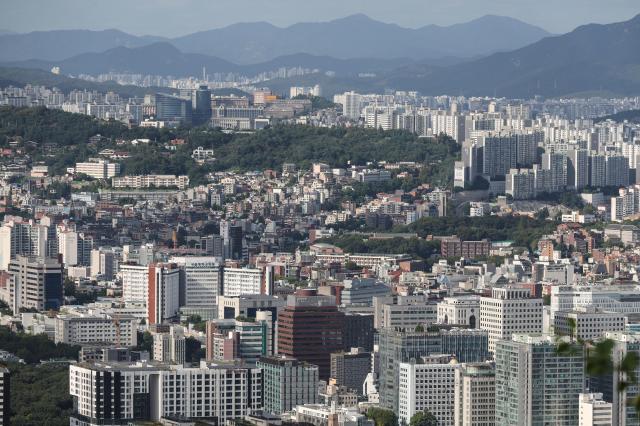
SEOUL, October 26 (AJP) -South Korea’s housing wealth gap widened to a record while income gains favored higher earners, deepening disparities between households at the top and bottom of the economic ladder.
Average owner-occupied housing wealth among the top fifth of households ranked by assets reached 290.1 times that of the bottom fifth in 2025, according to figures from the Korean Statistical Information Service, or KOSIS. The ratio rose from 244.9 a year earlier to its highest since comparable records began in 2017.
Income inequality also worsened in the latest annual comparison. The highest-income fifth received an average 173.38 million won in 2024, up 4.4 percent, while the lowest-income fifth received 15.52 million won, an increase of 3.1 percent, the official household finance and welfare survey showed.
Calculated from those figures, the income ratio widened to 11.17 to one from 11.03. The annual income difference increased by 6.89 million won to 157.86 million won.
The housing disparity was much larger, reflecting both differences in property values and the limited incidence of homeownership among households with few assets.
The top asset quintile held an average 693.41 million won in owner-occupied housing, up 7.7 percent. The bottom quintile’s average fell 9.1 percent to 2.39 million won, the lowest in the series.
The measure assigns zero to households that do not own their residence. It also excludes properties owned but occupied by someone else, including investment homes.
The 290-fold ratio therefore measures average housing holdings across all households in each group, rather than comparing the prices of homes owned by affluent and poorer homeowners.
Only 6.6 percent of households in the bottom asset quintile owned the homes they occupied, down 0.8 percentage point to a record low.
Among the top quintile, 82.5 percent owned their residence, down 1.2 percentage points. Despite the decline in ownership, the group’s average housing holdings increased as property values rose. The median residence value among homeowners in that group climbed 2.9 percent to 720 million won.
The housing wealth ratio has almost doubled from around 146 to one in 2017–2018. It reached 245.5 in 2022 before narrowing in 2023, then widened for two consecutive years.
The broader asset divide also reached a record.
Average total assets among the bottom fifth fell 2.9 percent to 25.88 million won, while the top fifth’s holdings rose 7.5 percent to 1.776 billion won.
That lifted the ratio to 68.6 to one from 62.0 a year earlier, surpassing the previous high of 64.0 in 2022. The figures cover assets before deducting debt.
Income disparities were smaller but also widened after adjusting for household size and accounting for taxes and public transfers.
The official ratio of income received by the top and bottom fifths on an equivalized disposable-income basis rose to 5.78 in 2024 from 5.72 in 2023. The disposable-income Gini coefficient, which rises as inequality increases, edged up to 0.325 from 0.323.
The latest deterioration qualifies the longer-term picture. The unadjusted household income ratio of about 11.2 remained below the 12–13 range recorded in the 2017–2019 surveys, even as it increased in the latest year.
The housing and income comparisons also involve different groups: households are ranked by assets for the housing figures and by income for the income figures.
The 2025 survey measures assets as of March 31, 2025, and income earned during 2024. Subsequent housing-market movements are not captured in those figures.
Copyright ⓒ Aju Press All rights reserved.